Central Oregon Rental Market Report · Q2 2026
Quarterly market report from Legacy Property Management
The Bottom Line: Redmond's rental market split into two different stories this quarter, and a landlord who looks at only one segment will draw the wrong conclusion. Apartments had their best quarter in over a year, with rent, occupancy, and lease-up times all improving. Single-family homes stayed soft, still taking two and a half to three months to lease. The reason is a historic apartment-permitting wave absorbing renter demand at the lower end of the market, while single-family homes face a thinner, slower pool of qualified tenants. If you own a Redmond SFH rental, price conservatively and plan for a 90-plus day vacancy cycle on turnover.
If you own or manage single-family rentals in Redmond, or if you are weighing a new acquisition, this quarter is a case study in why averages can mislead. Zoom out to "the Redmond rental market" as a whole and you would miss the real story entirely. Zoom in to just single-family homes and you would miss why that segment is struggling. The two segments are moving in opposite directions, and understanding why matters for every pricing and acquisition decision you make over the next two quarters.
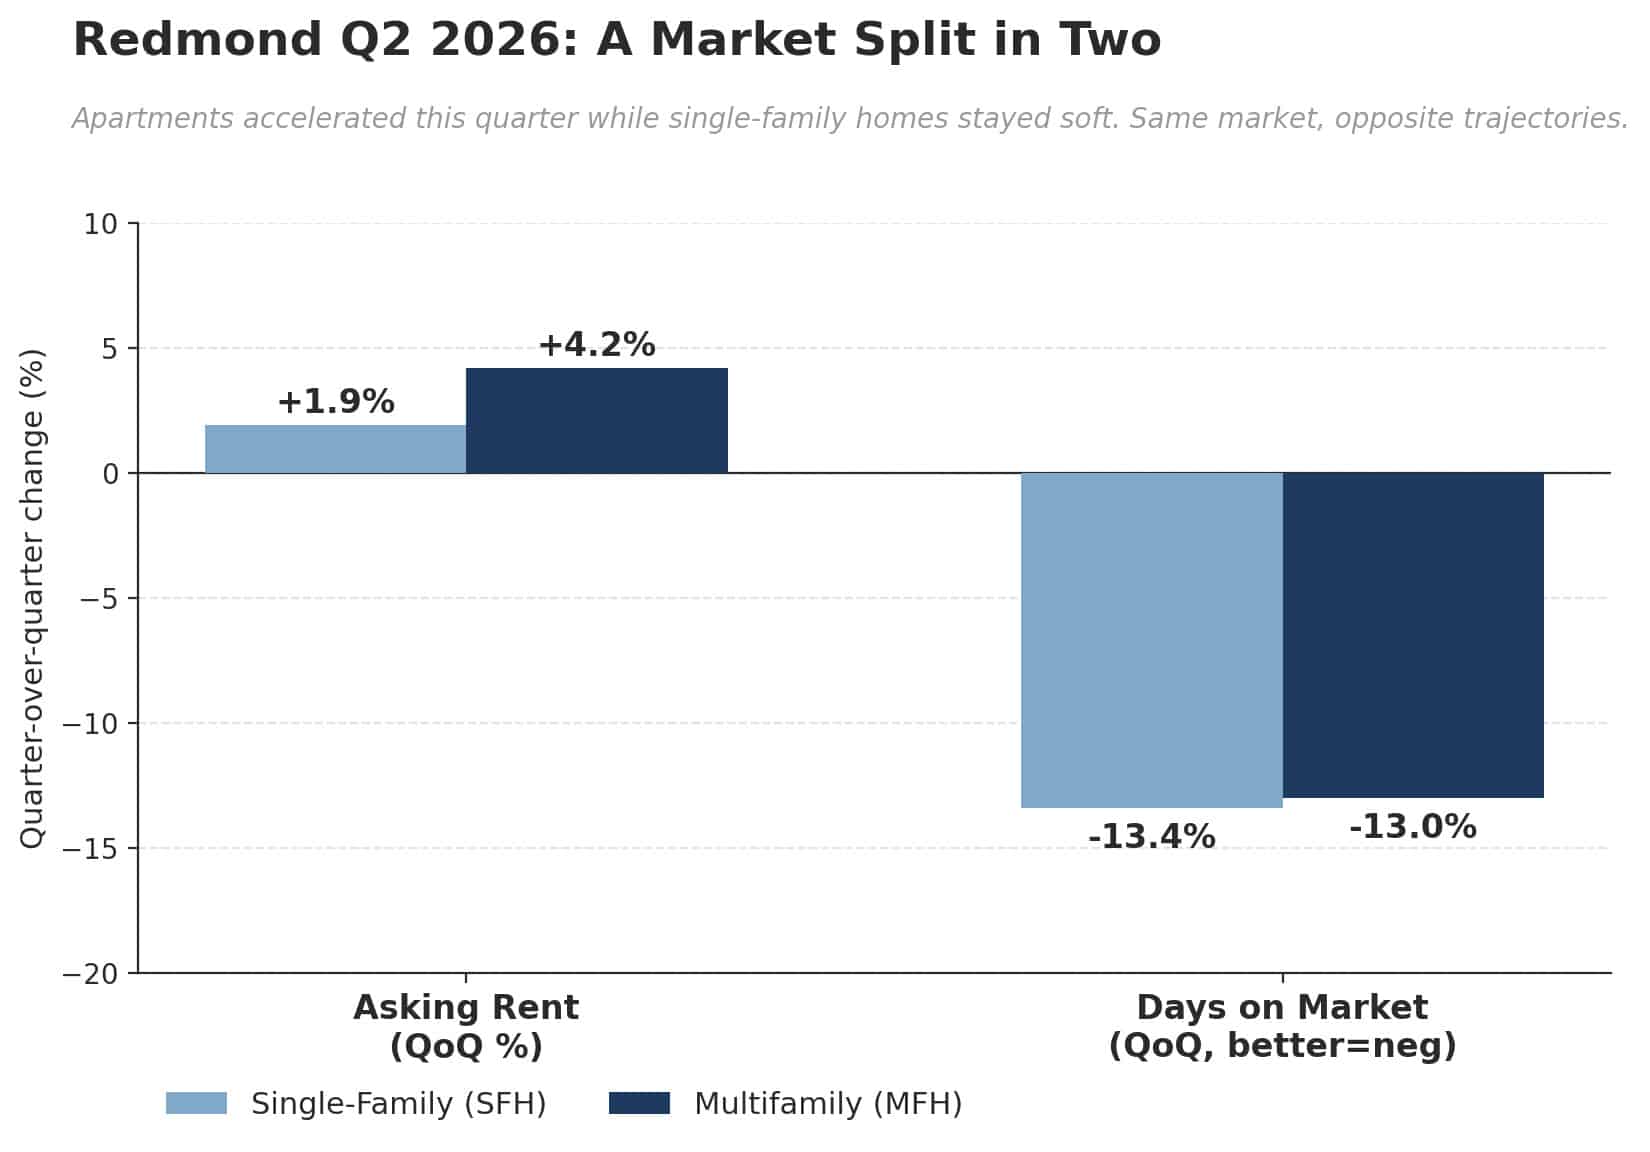
Apartments accelerated. Asking rent climbed roughly 4.2% quarter over quarter, occupancy rose to about 95.4% for the quarter and hit a stronger 96.4% by June specifically, and days on market improved. Single-family homes did not follow. SFH asking rent on the Zillow houses spine moved up a modest 1.9% quarter over quarter but remained down 7.7% from a year ago, and homes are still sitting on the market roughly two and a half times longer than they were in the second quarter of 2025. Redmond's historic apartment-permitting surge, which has nearly tripled over the past year on a trailing-twelve-month basis, is absorbing renter demand at the lower end of the market. Larger single-family homes, priced above what most of that new apartment supply offers, are the ones taking longer to place tenants.
The SFH Quarter at a Glance
Before the segment-by-segment detail, here is the single-family scorecard we track every quarter: asking rent, in-place rent, days on market, and available listings, each with quarter-over-quarter and year-over-year change where computable. Asking rent on the Zillow houses filter is our canonical spine, the number we hold consistent because it is public and reproducible. In-place rent is a secondary, broader-market estimate used for directional color, not as the anchor.
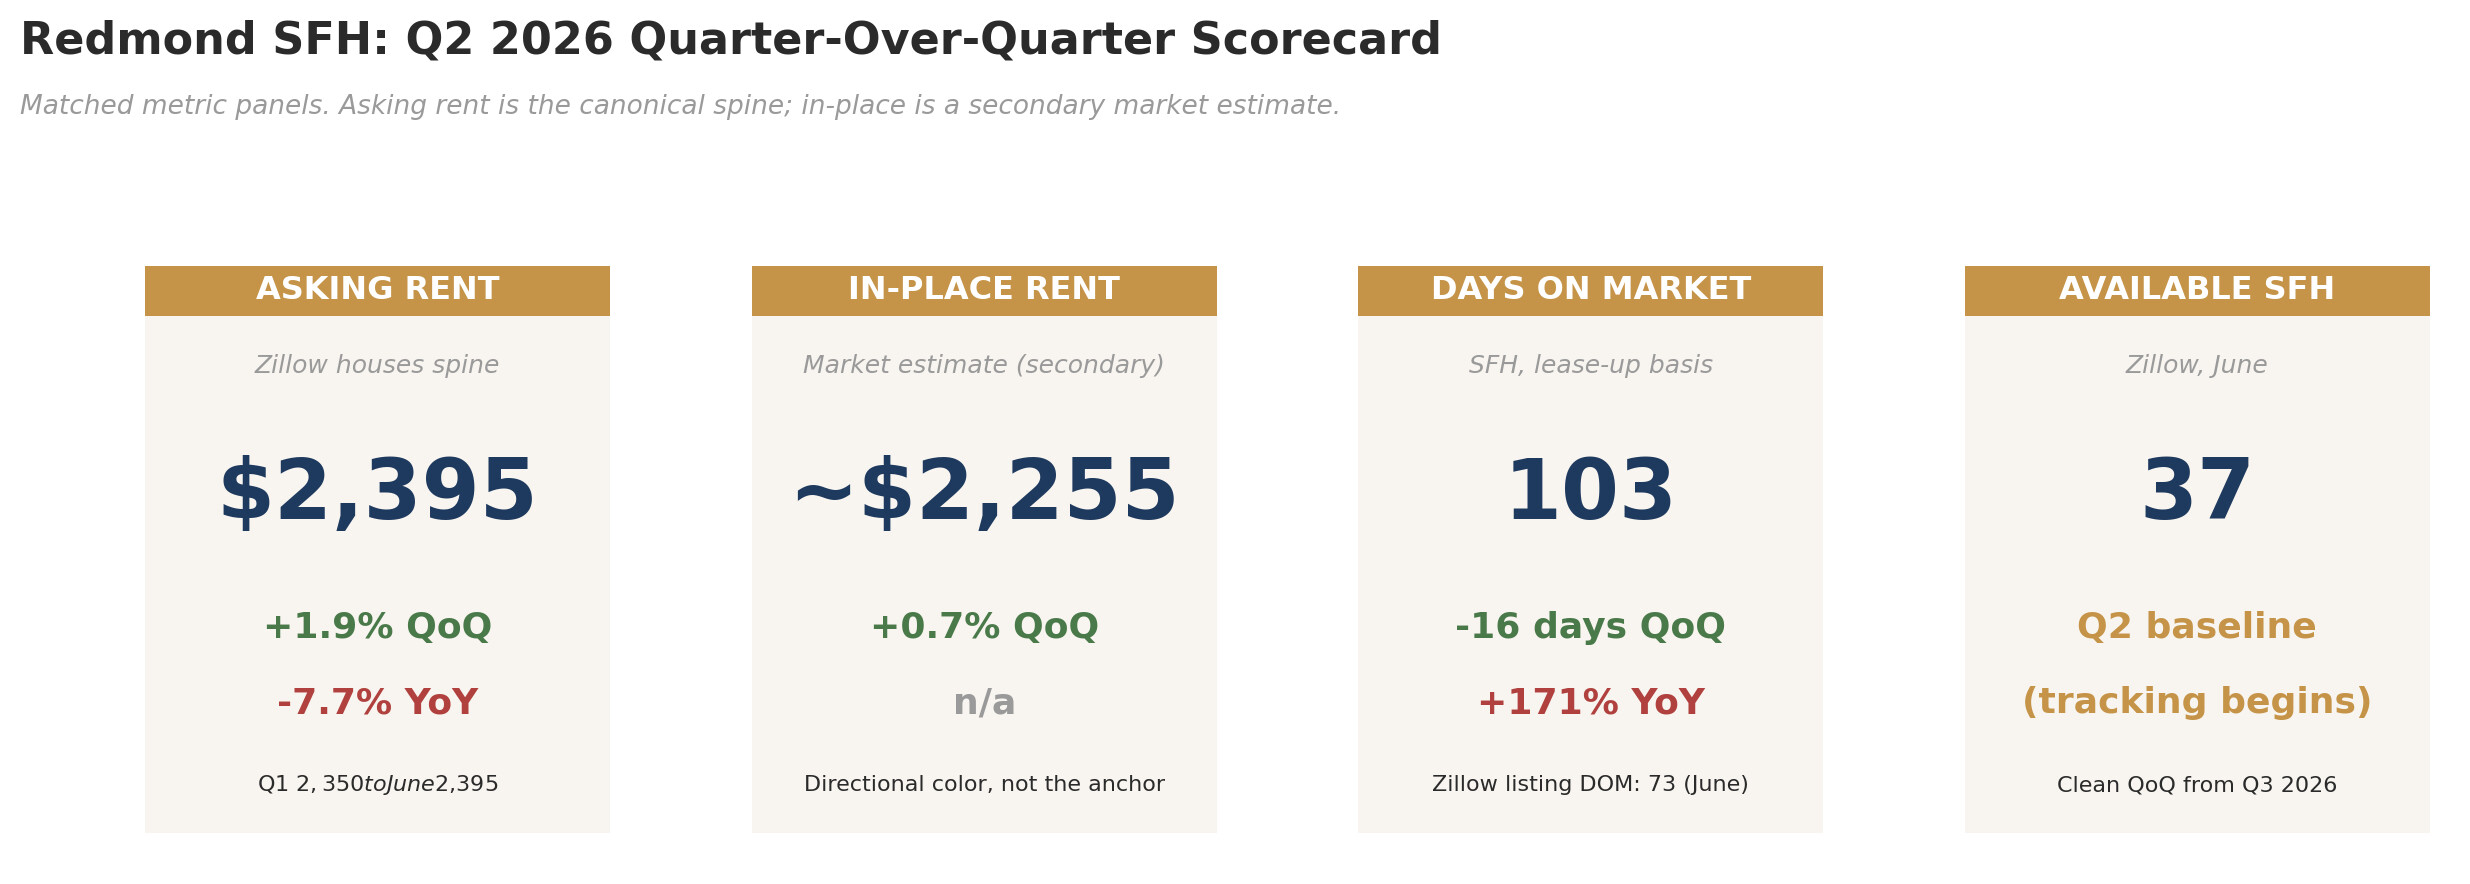
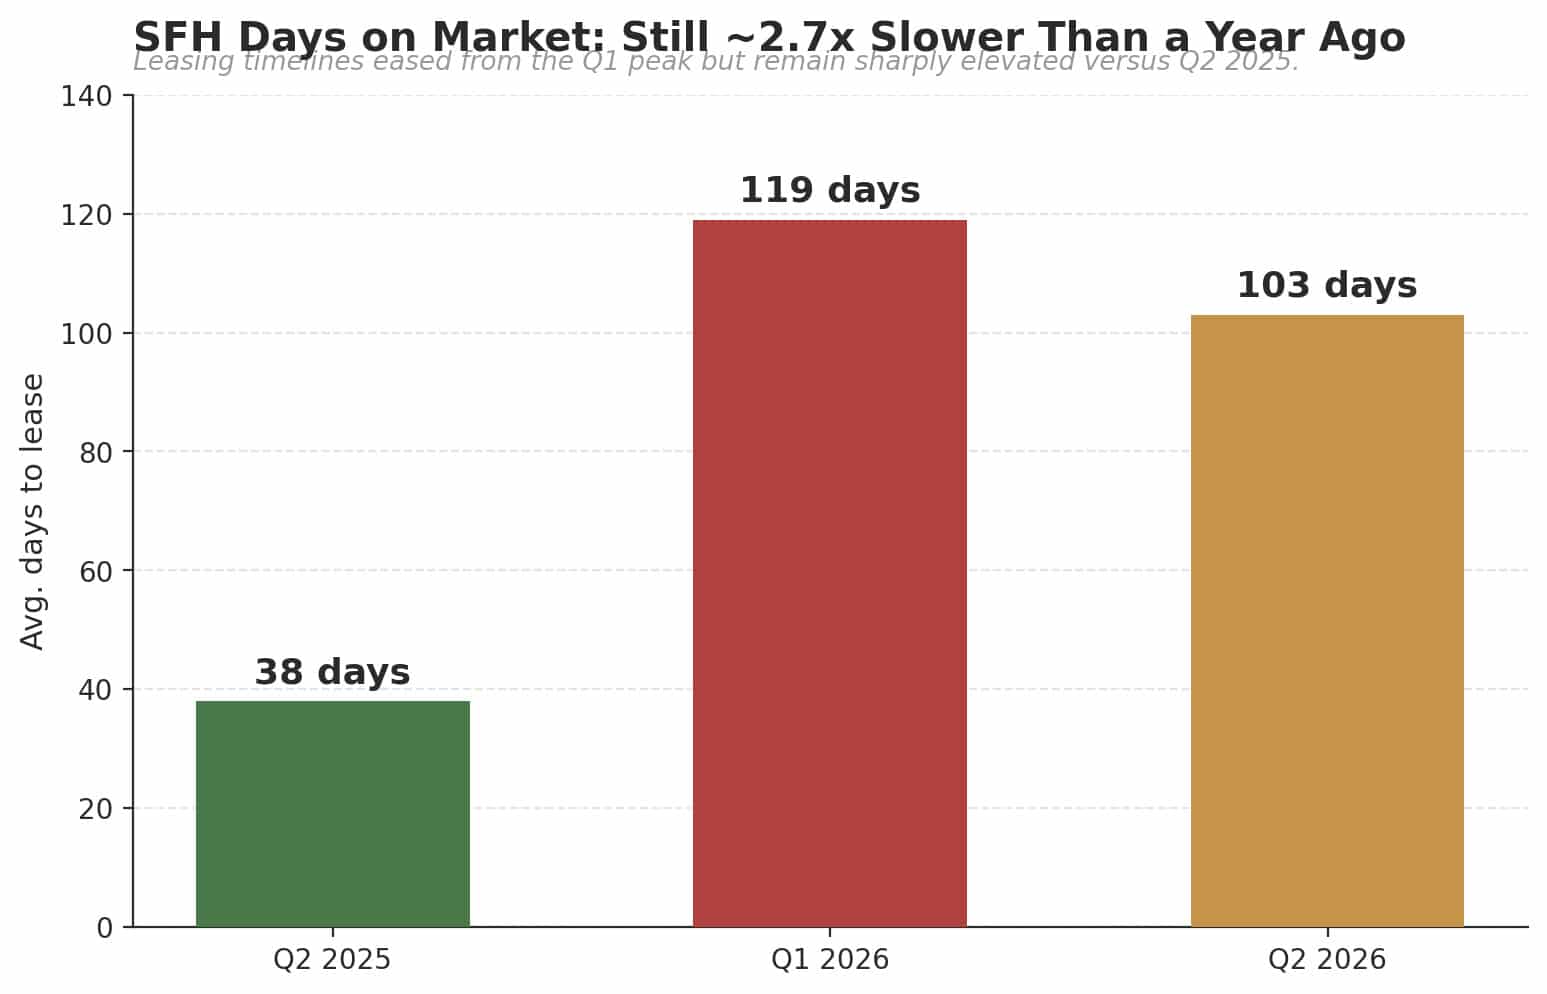
The tension at the top of that scorecard is the SFH half of this quarter's story. Asking rent is up 1.9% from the first quarter but down 7.7% from a year ago. That is not a contradiction, it is a market that reset sharply lower over the back half of 2025 and is now catching a normal spring leasing bump on top of a lower plateau. Days on market improved from a Q1 peak of 119 to 103 this quarter, a real 16-day gain, but that is still roughly 2.7 times slower than the 38-day pace from a year ago. Improvement, not recovery, is the honest read.
Apartments: The Best Quarter in Over a Year
Redmond's multifamily market had its strongest quarter in more than a year, and the strength is corroborated across three separate signals rather than resting on one number. Asking rent climbed to roughly $1,882, up about 4.2% from the first quarter and up 2.4% from a year ago. Occupancy improved to about 95.4% for the quarter, with June specifically hitting 96.4%, the highest single-month reading in over a year. Days on market fell to about 75, down from 86 in the first quarter. All three metrics point the same direction, which is what makes this a genuine trend rather than a one-off swing in a single series.

Days on Market: Still the Number to Watch for SFH
This is where the single-family story is sharpest, and where the quarter-over-quarter direction is genuinely good news even though the year-over-year comparison is not. A year ago, single-family homes in Redmond were leasing in roughly 38 days. That stretched to about 119 days by the first quarter of 2026. This quarter it eased to roughly 103 days, a real improvement, while Zillow's current-listing snapshot for June alone showed 73 days, suggesting the tail end of the quarter brought further relief beyond what the full-quarter average captures.
The financial stakes of that gap are direct. A home that sits vacant earns nothing, not a discounted rent, zero. On a roughly $2,395 house, every extra month of vacancy costs about $2,395 in gross rent that is gone for good. The practical takeaway has not changed from prior quarters: a modest rent reduction that meaningfully shortens vacancy time almost always beats holding firm for a marginal increase. In a market still running well above historical lease-up norms, pricing to lease is a cash-flow strategy, not a concession.
Where the SFH Pain Concentrates by Bedroom
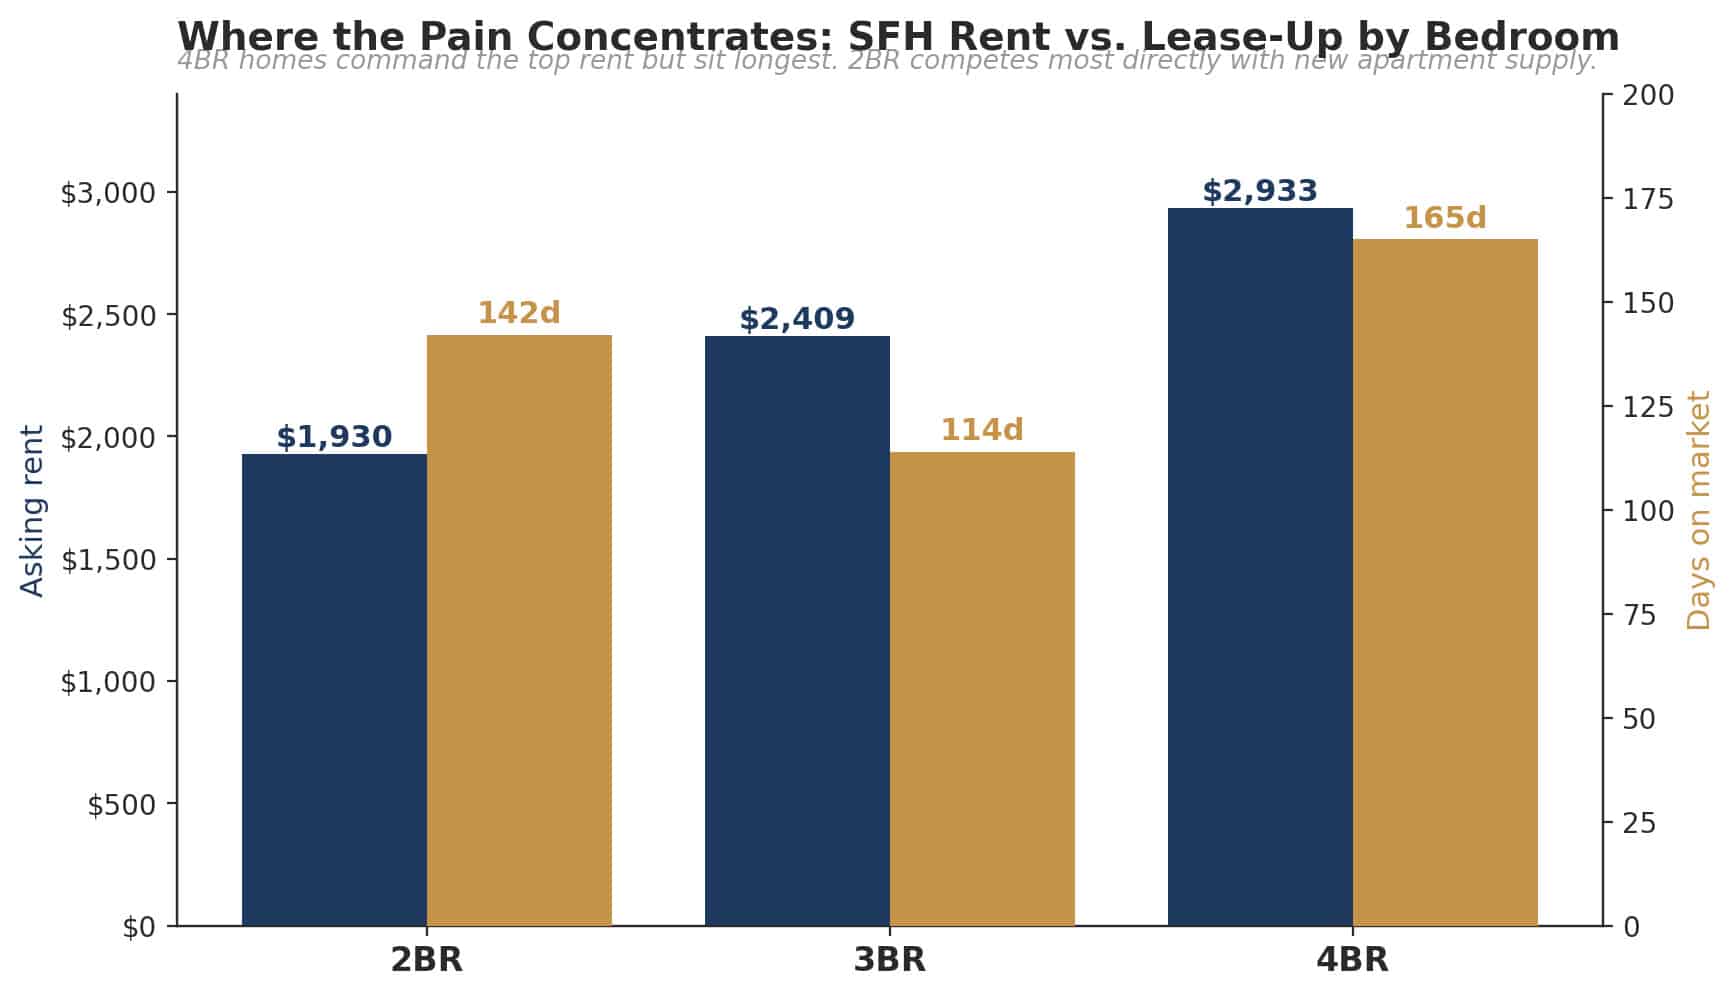
Averages hide where the real difficulty sits, and in Redmond it sits at the top and bottom of the bedroom range for different reasons. As of mid-June, three-bedroom homes, Redmond's dominant rental product, asked around $2,409 and took about 114 days to lease. Four-bedroom homes commanded the highest rent, roughly $2,933, but sat the longest of any category at about 165 days. Two-bedroom homes leased for the least, near $1,930, and took about 142 days, still slow in absolute terms but faster than the larger categories.
Townhomes are worth a specific mention here, because they are quietly outperforming detached single-family homes on speed. A three-bedroom townhome asks around $2,073 and leases in about 39 days, compared to $2,409 and 114 days for a comparable detached SFH. If turn time matters more to your strategy than peak rent, townhome product is currently the faster-moving asset class in this market by a wide margin. For detached SFH specifically, anything priced above roughly $2,000 a month is taking three to five months to place a tenant, and larger homes face a thinner pool of qualified households than the mid-market three-bedroom product.
Average Tenancy: A Reason to Fight for Every Renewal
Redmond does not publish a clean single-family tenant-tenure figure, so we use the local multifamily retention rate as a directional floor. Apartment tenants renew at about 63.7% annually, implying roughly 2.8 years of average tenure. Single-family renters nationally tend to stay longer than apartment renters, often three or more years, because moving out of a house is a bigger disruption. Redmond's renter base reinforces that structurally: the market skews young and family-heavy, with roughly half of renters being families, which tends to support longer stays.
In a market where SFH lease-up still runs 100-plus days, that retention math is decisive. Losing a tenant does not just cost you a turn, it costs you three-plus months of exposure to a still-slow SFH market on the way to replacing them. Every renewal you protect this quarter is worth more than the marginal rent bump you might chase by testing a vacancy.
Bonus Metric: The Apartment Wave That Will Shape 2027
The number that explains this quarter's divergence, and that should shape your outlook through 2027, is in the building permits, not the rent data. Across the Bend metro area, which drives regional supply dynamics for all three Central Oregon submarkets, multifamily permitting has nearly tripled year over year. On a trailing-twelve-month basis through May 2026, implied multifamily permits rose from roughly 659 units to about 1,809 units, a gain of around 174%, per Census Building Permits Survey data compiled by the Federal Reserve's FRED database. Single-family permitting, by contrast, ticked only modestly higher, up about 4.4% on a trailing-twelve basis to roughly 1,477 units.
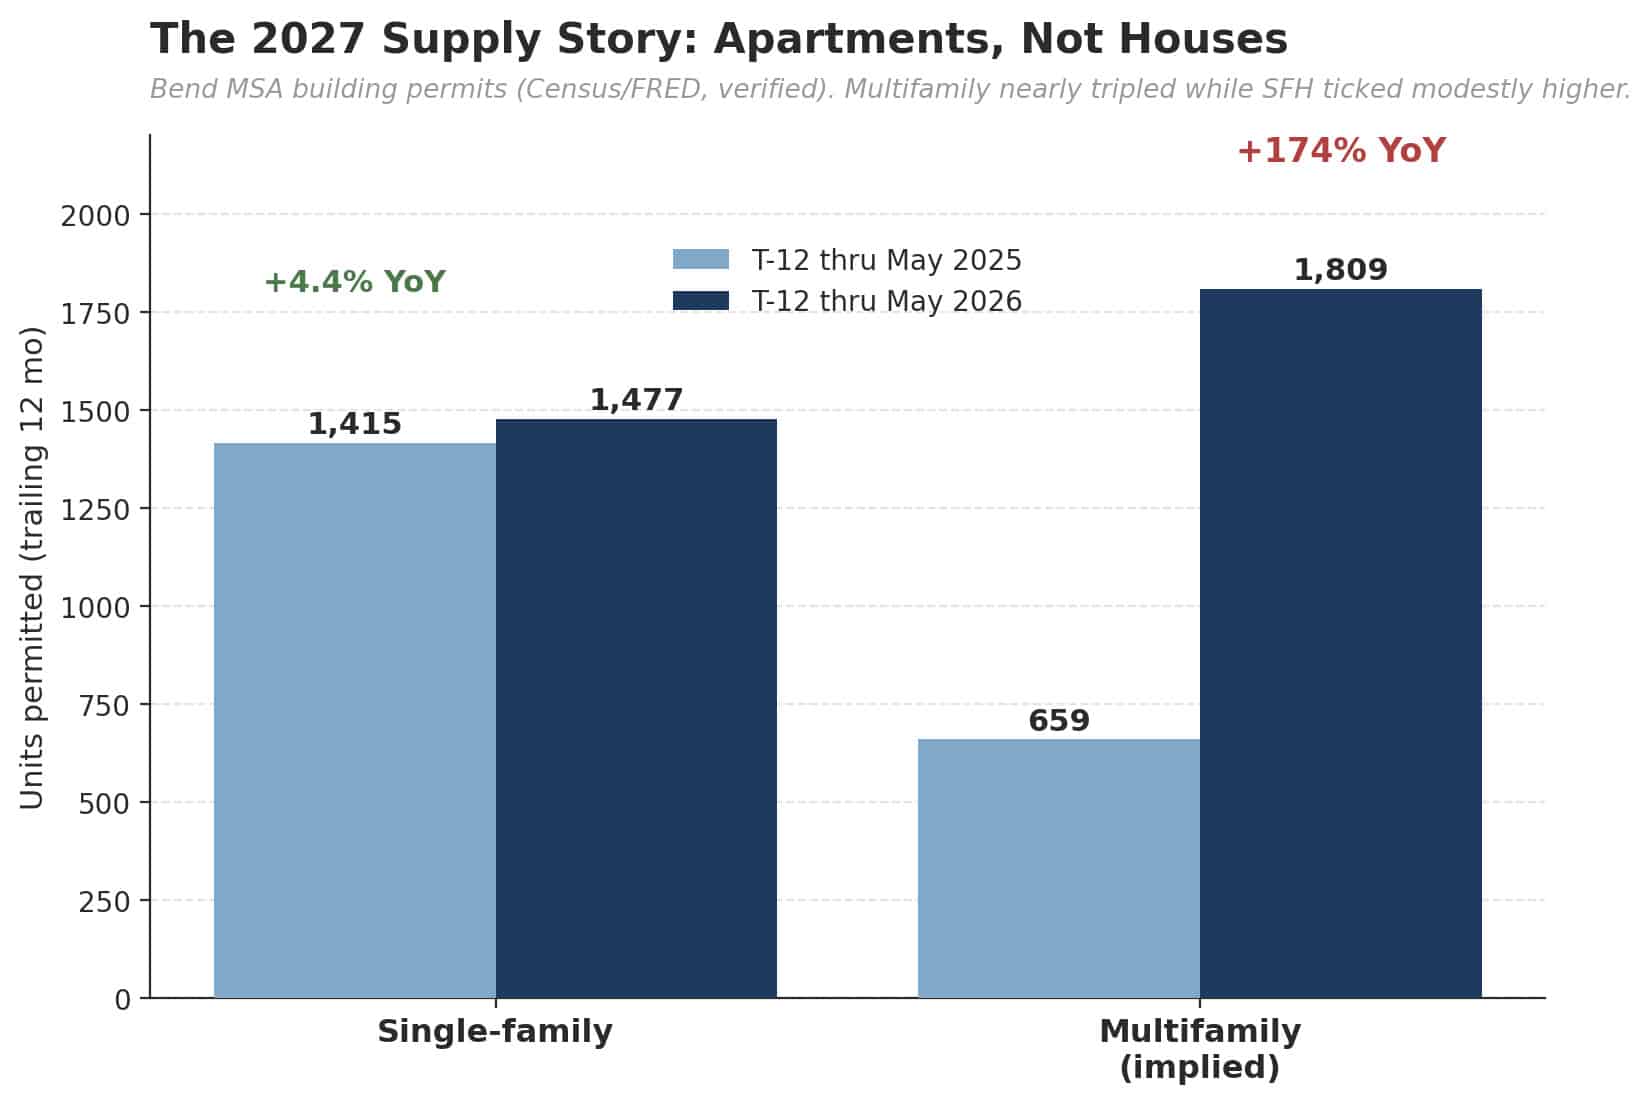
This is a credible structural explanation for the divergence you are seeing between segments this quarter. Apartments are absorbing a wave of new competing supply and still posting rent and occupancy gains, a sign of genuinely strong underlying demand at that end of the market. Single-family homes are not facing new detached-home competition directly, but they are likely facing indirect competition from that apartment wave at the lower end of the bedroom-count spectrum, studios through two-bedroom units, which lines up with why 2BR SFH product leases faster than the 3BR and 4BR product above it. Watch this pipeline closely. A historic supply wave of this size rarely resolves without some rent-growth deceleration once it fully delivers, and that could pressure smaller-unit SFH rents indirectly over the next several quarters even without a single new detached home being built nearby.
What This Means for You
Two takeaways should shape your next move this quarter. First, do not extrapolate 2024-era fast-turn assumptions onto a Redmond SFH listing today. Budget 30-60 days of vacancy on turnover, price at or slightly below the recent asking-rent average for your bedroom count, and prioritize keeping a paying tenant renewed over testing the market for a marginal rent increase, especially above the $2,000-a-month threshold where lease-up times balloon. Second, treat the apartment permitting surge as the variable to monitor, not ignore. It is currently a demand-absorption success story for multifamily owners, but a supply wave of this size rarely resolves without some deceleration once it delivers, and that could pressure your smaller-unit SFH rents indirectly over the next several quarters.
| Move | What to do | Why it works this quarter |
|---|---|---|
| Price to lease | List at or just below the market ask for the bedroom count. | SFH lease-up still runs 100-plus days; a small discount that halves vacancy beats holding for a marginal increase. |
| Underwrite realistically | Model 90 to 140 days of SFH vacancy on turnover. | Both the internal panel and Zillow confirm elevated, not normalized, lease-up times. |
| Protect renewals | Prioritize renewals over rent-testing on SFH units. | Every retained tenant avoids three-plus months of slow-market re-lease exposure. |
| Position against apartments | Emphasize yard, garage, and privacy for smaller SFH product. | The apartment wave competes hardest for studio-through-2BR renters, not larger households. |
| Watch the permit pipeline | Track multifamily deliveries through 2027. | It is the leading indicator for whether MFH strength continues or cools, and for indirect SFH pressure. |
Work With Legacy: Navigating a Redmond market that is moving in two directions at once takes local expertise and hands-on attention to pricing, positioning, and tenant retention. Our Redmond property management team partners with investors across Central Oregon to protect occupancy and maximize returns through exactly this kind of market. Reach out today to see how we can help.
Data sources: Zillow Rentals and Zillow Home Value Index (asking rents, listings, home values); Redfin (sale prices); U.S. Census Building Permits Survey via FRED (permit data, independently verified this quarter); U.S. Census Bureau American Community Survey 5-year estimates (demographics, directional anchors with wide margins of error at the city level); U.S. Bureau of Labor Statistics and FRED (Deschutes County and Oregon unemployment); and internal Central Oregon rental market data for single-family and multifamily rent, occupancy, and days-on-market series. County-level figures describe Deschutes County as a whole, which is roughly 80% Bend by population, and do not describe Redmond specifically. The multifamily tracked panel expanded materially within this quarter (roughly 966 to 1,547 units, May to June); rent and occupancy percentages are treated as directionally reliable and corroborated by an independent days-on-market improvement, but the raw unit-count change should not be read as a literal supply event. Single-family vacancy is estimated from listing and leasing activity. Tenancy length uses a multifamily retention proxy and is labeled as such. Figures reflect Q2 2026 and are deemed reliable but should be independently verified.



Redmond Rental Market: August 2026
September 10, 2026 Redmond Rental Market: August 2026 Home Central Oregon Rental Market Report · August 2026 Monthly market report from Legacy Property Management The

Sisters Rental Market: August 2026
September 10, 2026 Sisters Rental Market: August 2026 Home Central Oregon Rental Market Report · August 2026 Monthly market report from Legacy Property Management The

Bend Rental Market: August 2026
September 10, 2026 Bend Rental Market: August 2026 Home Central Oregon Rental Market Report · August 2026 Monthly market report from Legacy Property Management The